


What is Data Science?
This article first appeared in German in the IT Freelancer Magazin
The term “data science” has become a buzzword in recent years, and describes an interdisciplinary field in which topics from mathematics, statistics, and computer science come together.
Broadly speaking, it is about asking questions, and then answering them in a data-based manner. Some examples of such questions are:
- Is this email spam or not?
- Will a credit applicant repay this loan or default?
- What will be a fair price for this house?
- Will this customer buy product X?
- What kind of product is most interesting for this customer?
A Data Scientist begins with a question similar to these, and then works on collecting, evaluating, and interpreting data until the question is answered.
What does a Data Scientist do?
Hilary Mason, a former Data Scientist in a venture capital firm, and now a startup founder, wrote a blog post where she describes the activities of a Data Scientist with the acronym OSEMN:
- Obtain Data: This means collecting data from one or more (possibly heterogeneous) sources. These can be, for example, automatically created Excel tables, or all tweets of the last 24 hours. For the first case, mastering the command line or a scripting language (e.g., Python) is essential; in the second case, the APIs of the respecitve web applications are also helpful.
- Scrub Data: Cleaning the obtained data often takes most of time across all steps. Data from different sources must be merged so that they can be further processed and analyzed as elegantly as possible in the next steps. For example, the analyst has to generate new information from existing data (a step called Feature Engineering), or suitably replace missing values. Tools that help here are, among others, the Linux tools
sed/grep/awk, and Perl or Python. - Explore Data: Analyses can now be done efficiently with the cleaned data. Before you make assumptions (hypotheses) or generate predictions, you should first look around in the data set exploratively. Typically, this means looking at some sample data (e.g., the first 10 lines) or creating summaries of the data – either numbers (such as mean values), or graphics. For example, you can create histograms of single variables, or scatter diagrams to gauge the relationship between two variables. In the example above of analyzing tweets, one could create frequencies of words or hashtags, and sort them in descending order.
- Model Data: Now you can use your data to form models. The information contained in the data is abstracted, for example in a set of rules. Think of a credit institution that would like to create a few rules on the basis of the loans granted in the last 10 years to predict the probability of a new request being repaid. The computed model could then be used to generate rules such as:
- Employees are 20% less likely to default than self-employed applicants
- With each additional year of age, the probability of default decreases by 2%
- Higher loans lead to higher default rates in consumer loans, but for real estate loans, it is the other way around (These examples are only fictitious, of course)
- Interpret Data: A created model can then be used to interpret the data. The credit institution can now create an internal guideline for granting loans according to the results from this example analysis.
A data scientist usually accompanies the entire workflow, from collecting the data to formulating a recommendation for action based on the findings obtained. Both the classical “hacker” skills (for example, working on the command line), as well as the understanding of algorithms from statistics and machine learning are essential in this workflow.
How does a machine learn?
This is tried to answer in the field of machine learning. Here, algorithms are developed that allow computers to derive generalizations (“rules”) from a series of data.
In general, a machine learns by looking at a data set, and recognizing structures there. It may e.g. look at a table of loans granted over the past 10 years, recognizing that consumer loans are more likely to default than real estate loans, and that large sums are more likely to default than lower ones.
There are a variety of different algorithms, all of which differ in their methods, priorities, and often also in their results. A currently very popular algorithm called Random Forests is based on classification trees, which are very intuitive to understand.
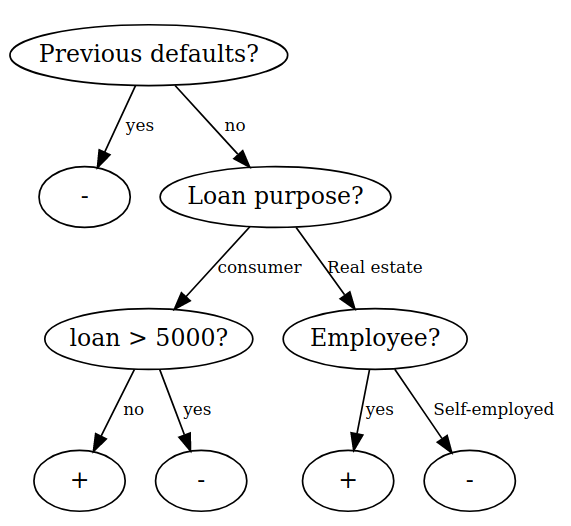
A classification tree creates a hierarchically ordered set of criteria (splits), through which new data then passes and ends up in a leaf node. There are various algorithms for calculating such a tree; among the most well known ones are e.g. CART and C4.5. The result, however, is always a tree, such as in the above figure.
A tree created in this way can now be used to make a prediction for a new credit request. If a self-employed person who has not yet had any previous failures wants a consumer credit of more than 1500 euros, we can walk through the tree and give him the credit in the end (for this person and this tree, the distinction between employee or self-employed plays no role).
More complex methods
This example tree was, of course, a highly simplified model. In reality, models are usually much more complex, and can be aggregated from a set of, say, 500 trees. Each single tree makes its own prediction, and in the end, the final prognosis is decided by the majority vote between all trees. This is the basic principle of Random Forests, an algorithm that is currently among the top candidates in terms of prediction power.
By making such an ensemble of many “small” models, the predictions become more robust and accurate. An additional advantage is that the “vote” among 500 trees can now output a kind of probability for the classes “+” and “-“, instead of giving only a bare forecast for the class “+” or “-“.
With powerful methods such as this one, many real problems can now be solved:
- Recommender systems can give new movie recommendations, based on the movies you watched before and your ratings of them, combined with similarly rated movies of other users.
- Google’s PageRank algorithm can sort a series of search results based on the estimated relevance for the seeker.
- Deep learning / Neural networks are methods whose functioning was inspired by the human brain. Here, many small “neurons” are communicating with each other to make a prediction, and can also perform complex tasks, e.g. speech recognition or image recognition.